HOW DOES THE COUNTY OF LOS ANGELES INVEST IN arts and culture?

Background Art 1
Background Art 2
Background Art 3
Background Art 4
Background Art 5
Background Art 6
Background Art 7

What do we mean when we say "LA County"?

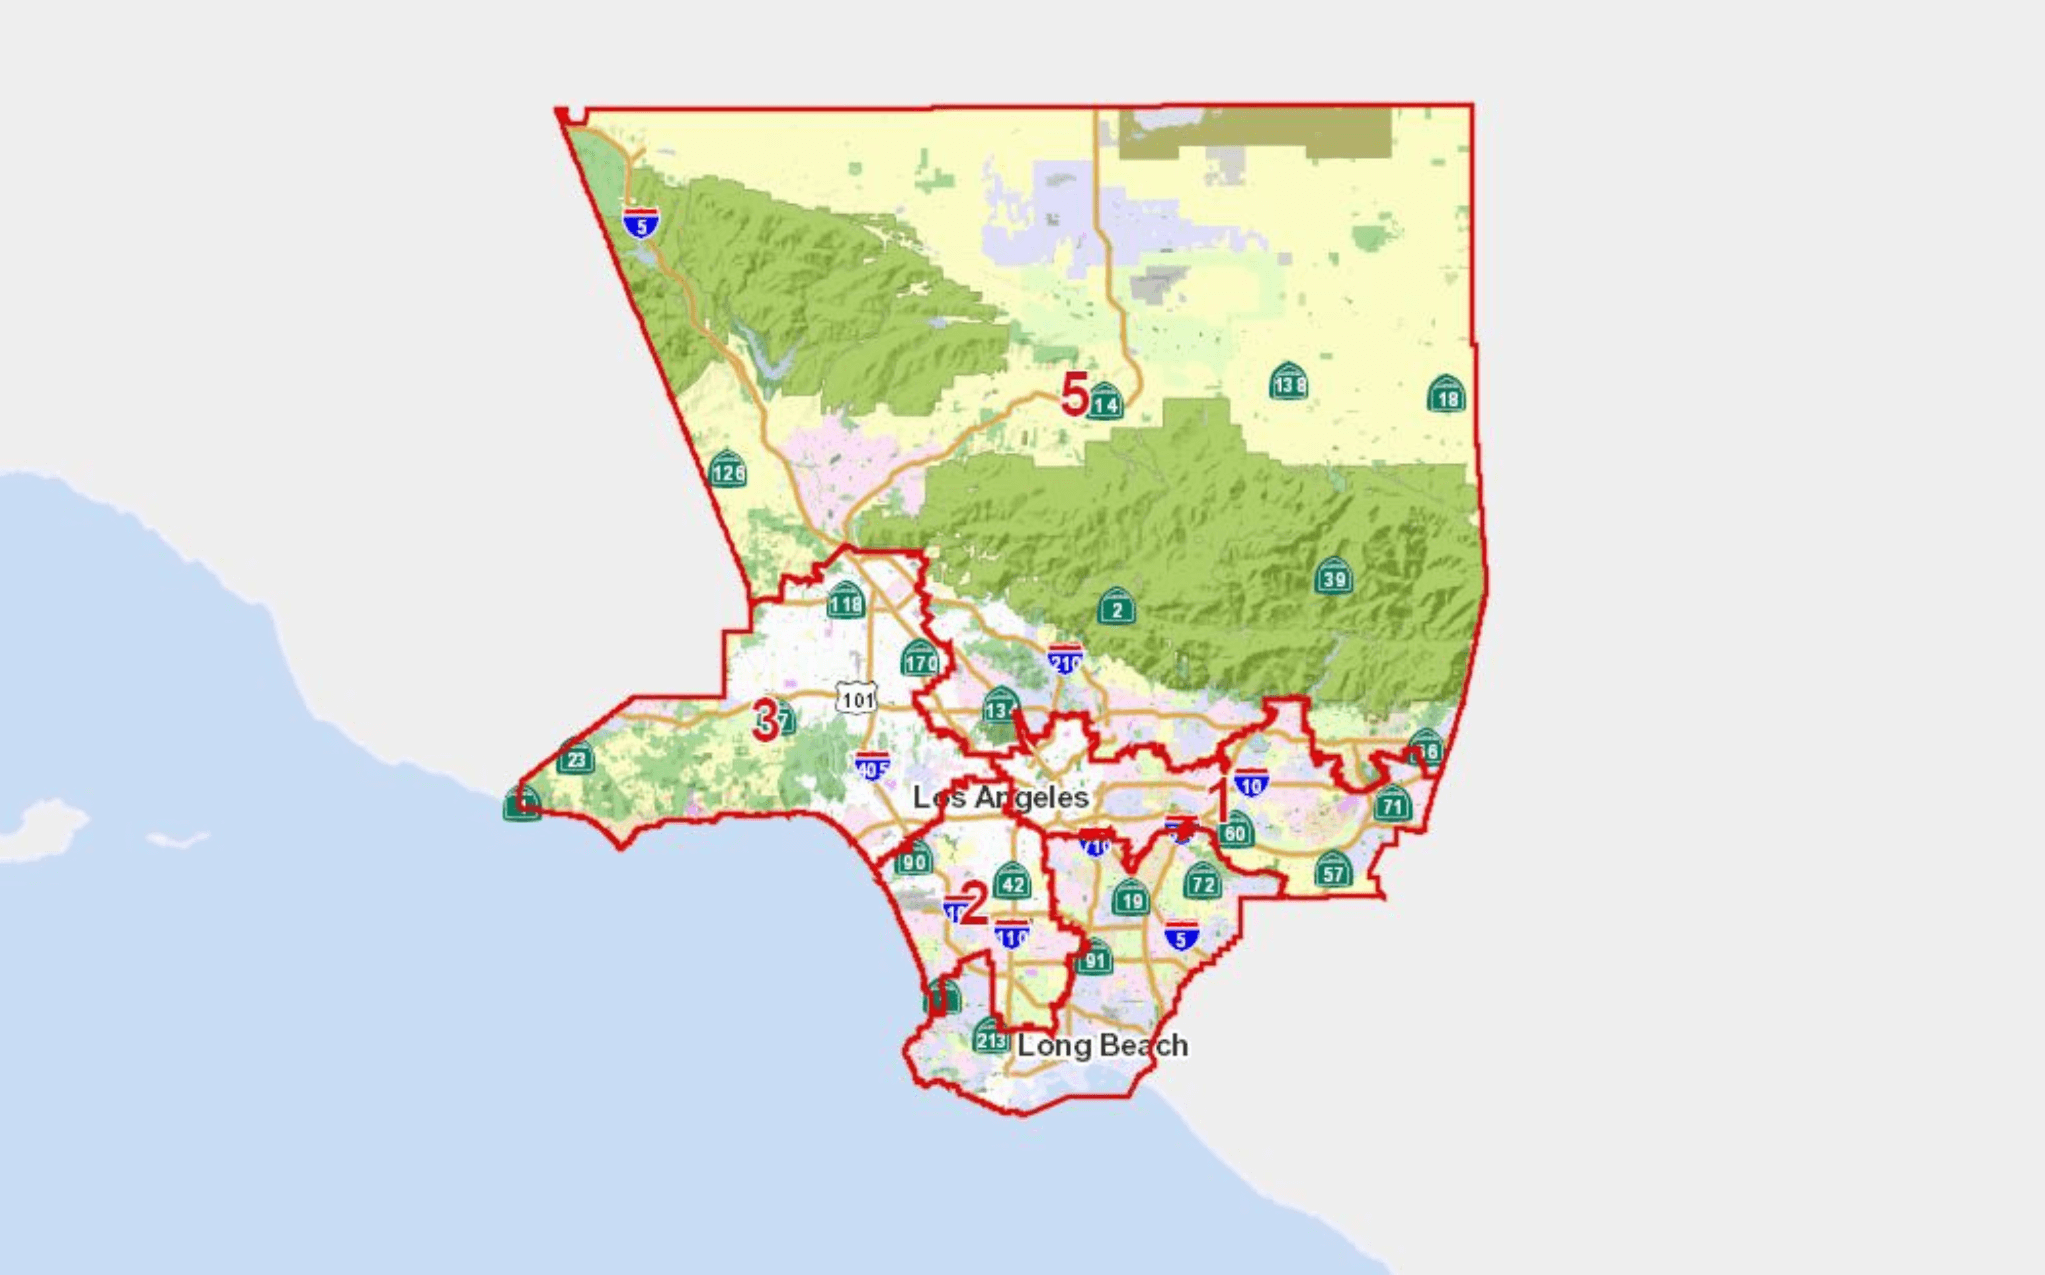
LA County is a geographical region where 10 million people live. About 9 million of them live in 88 different cities. The largest is the City of Los Angeles, with nearly 4 million residents. Another 1 million live in unincorporated areas.

The County of Los Angeles (or LA County government ) is also the name of the government that provides a wide range of services to the people who live within the geographical region of LA County, from Public Health to Social Services to Arts and Culture.

This story map shows how the LA County government invests in arts and culture across the LA County region.

WHAT DO WE MEAN WHEN WE SAY “ARTS AND CULTURE”?

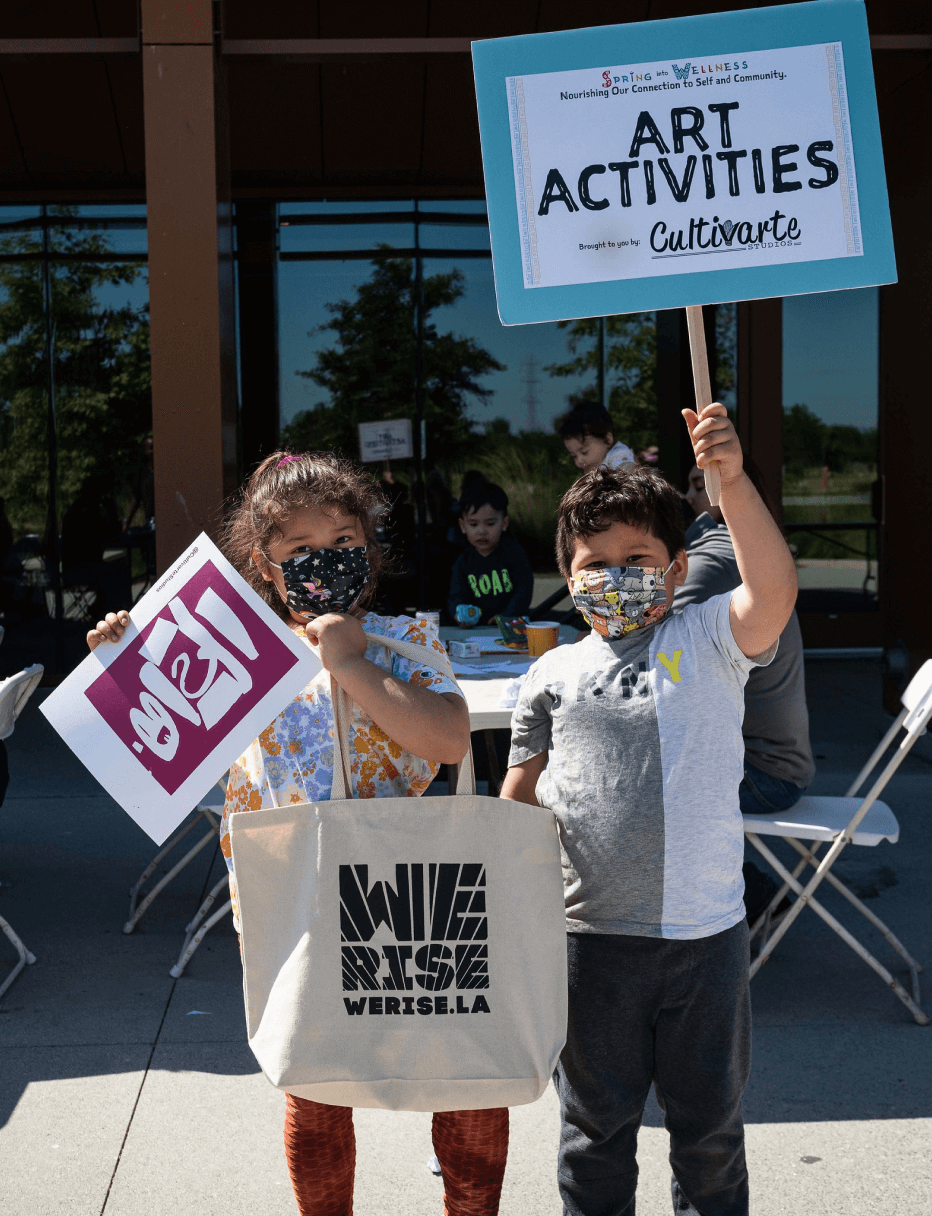
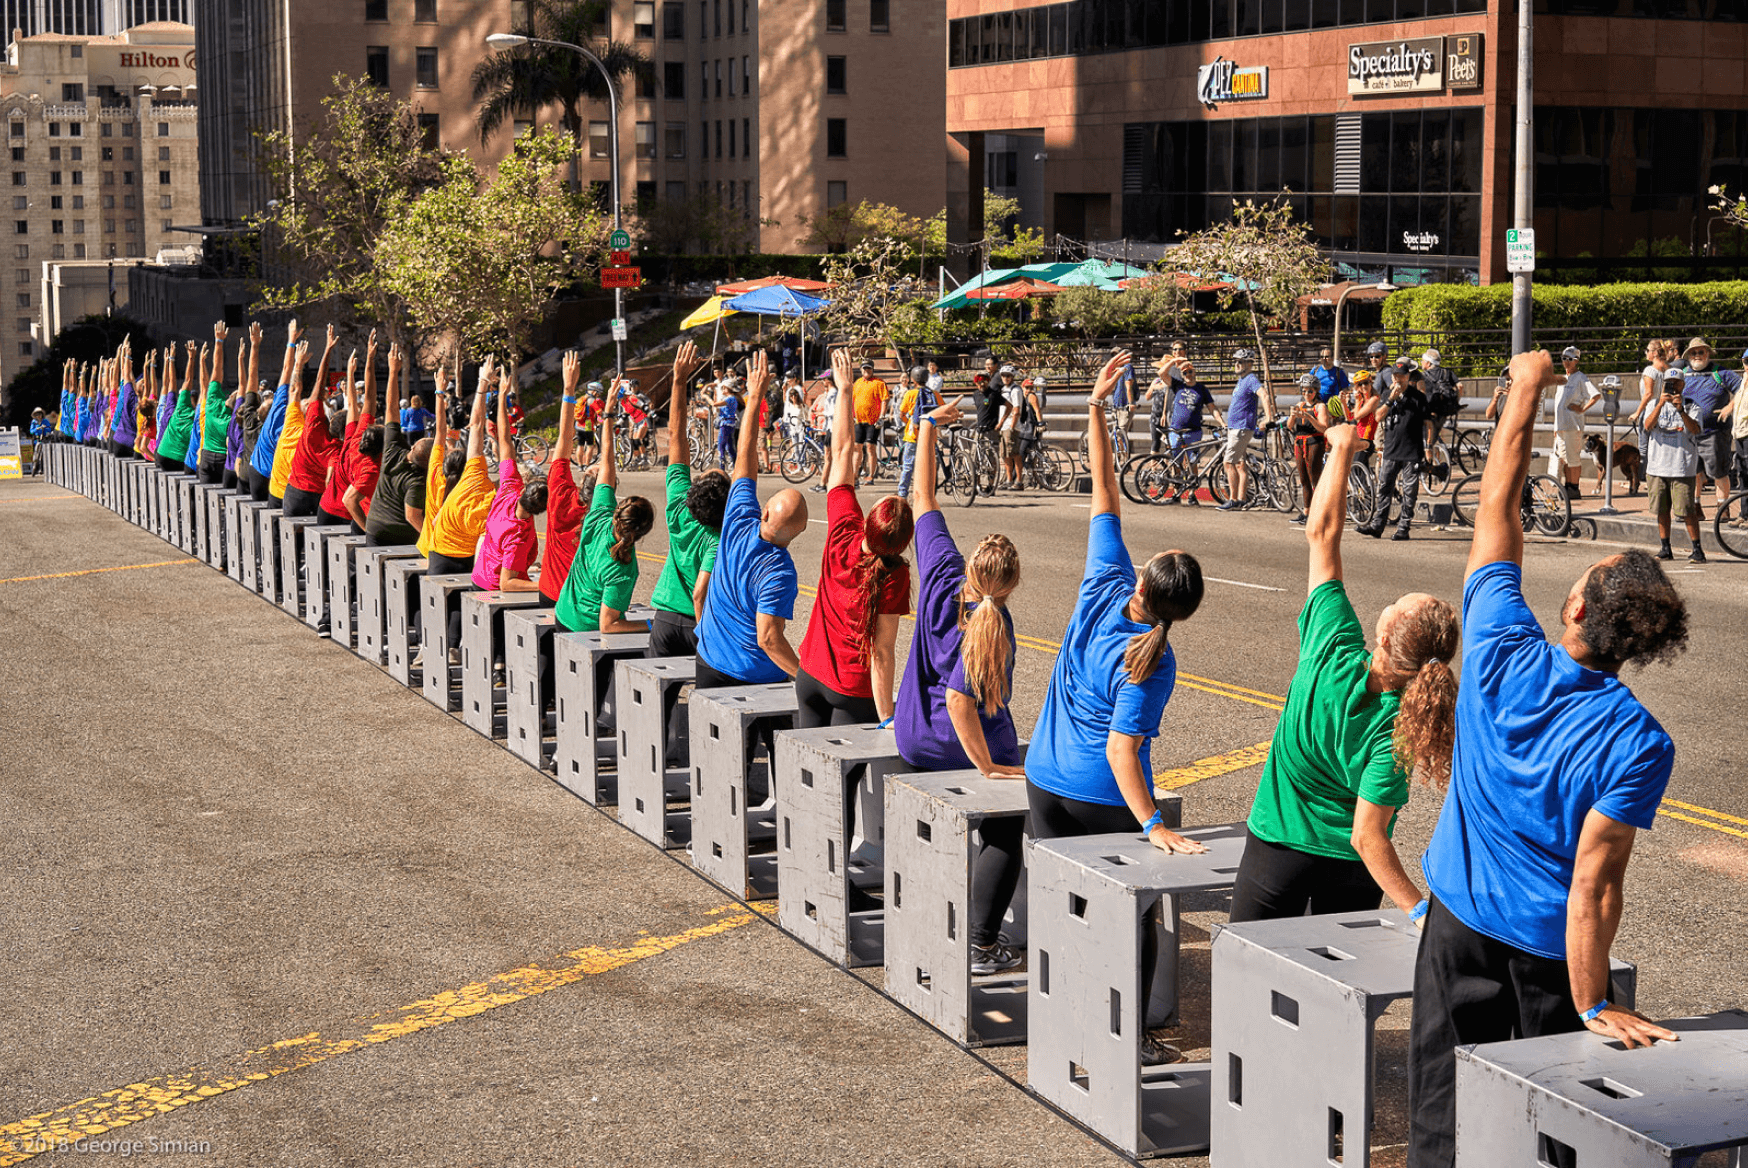
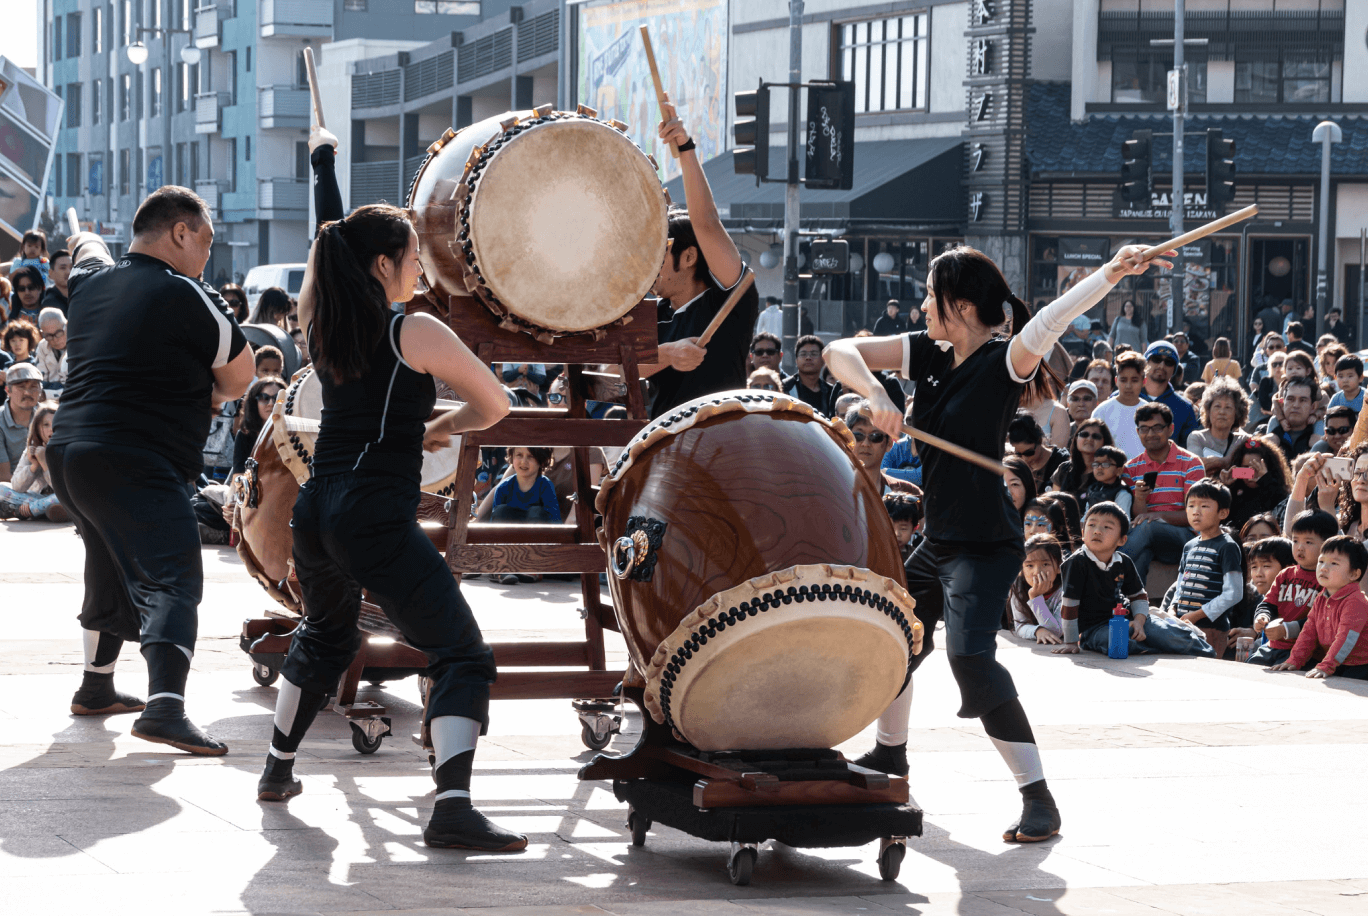
When we say “arts and culture” in this study, we mean a broad range of activities. This could be formal activities that take place in museums or theaters, or that involve attending events, or viewing art created by professional artists.

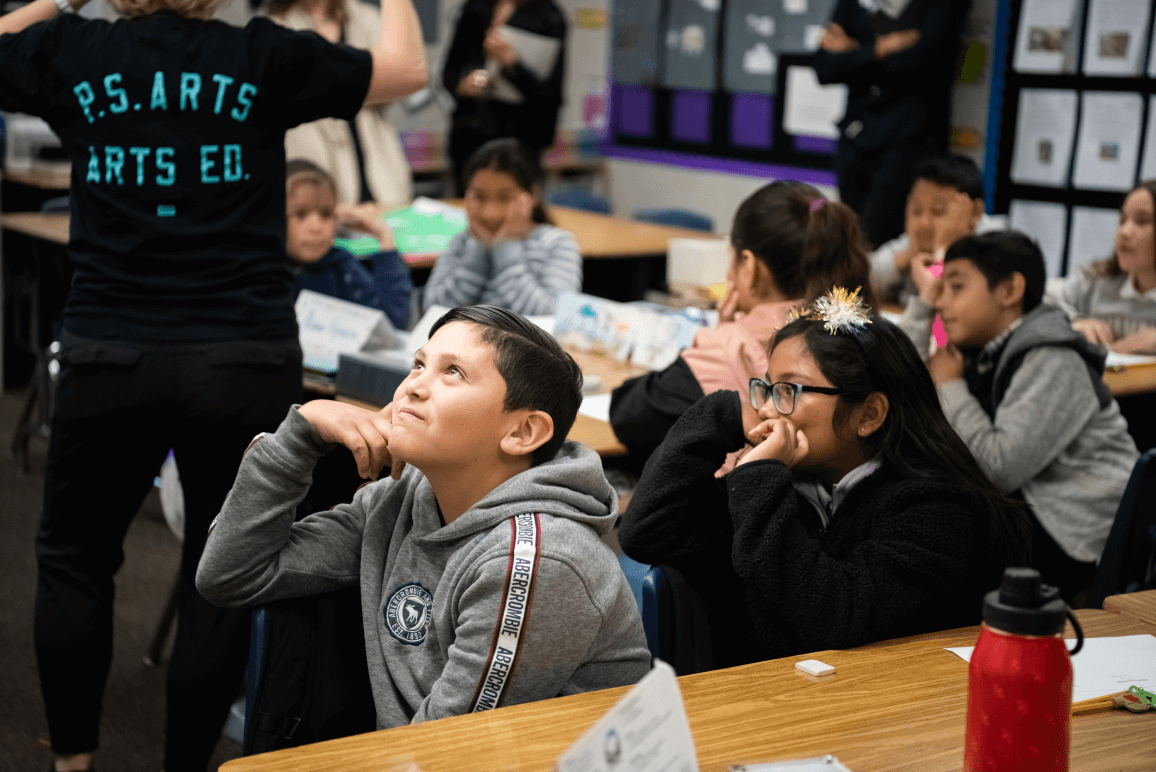
It can include participatory arts education or classes where youth, families, or people of any age learn how to play an instrument, engage in arts learning, cook healthy food or engage in any form of a creative activity. It can also include informal activities where young people have an opportunity to express themselves through creative writing, drawing, singing, or playing music. It includes ticketed events with prescribed beginning and end times, or free informal events where people come and go as they like. Tip: This storymap is best viewed on a computer screen at full size.

HPI Index (uncropped)

County Cultural Institutions

LA County government's most visible investments in arts and culture may be the museums and performing arts venues they support.

This chart shows the annual “County Investment” in each of these institutions as reported in the LA County Budget. It also shows the “Total Revenue” those institutions raise from all sources, as reported on their IRS 990 forms. In sum, LA County government provided $94.5M. At the same time, these institutions raised $535.3M to fund the full cost of their operations.

These figures are from 2019-20 and may reflect early pandemic revenue losses. The dollar amounts shown do not include funds provided by the County for capital projects. They do not include the value of any land or facilities owned by LA County government and provided to those institutions, nor do they reflect any rent paid by these institutions. They do not include funds or the value of any services provided by or funded through other County departments.

Each of these institutions is managed independently by its own staff and board of directors. While some of these cultural institutions are departments of County government, others are not. To learn more about each of these cultural gems, visit their websites below:

Fairplex

LA Phil , which also manages the Ford Theater and Hollywood Bowl

LA Plaza de Cultura y Artes

LA County Museum of Art (LACMA)

Natural History Museum

The Music Center , which also manages Grand Park


County Culturals

DEPARTMENT OF ARTS AND CULTURE: DOLLARS INVESTED

LA County government invests in communities across the region through a wide range of programs managed by the Department of Arts and Culture.

In this map, you can explore four grants programs and school-based arts education, showing the amount of money each program invests annually in every zip code in the LA County region.

Each zip code is color-coded to show the amount of arts and culture investment, from the largest 20 percent to the lowest 20 percent. Click the Legend in the map to see details.

To see distribution of each of the different programs, click the layers button . In the drop-down menu, select the grant program you want to see. For best results, make sure you only have one program checked at a time.

When you click on a specific zip code, the pop-up window shows how much funding from each grant program was invested there.

Note: This map doesn't include administrative costs and programs that don't have a geographic element.

To see all the Department of Arts and Culture's investments combined, keep scrolling.

DEPARTMENT OF ARTS AND CULTURE: ARTS EDUCATION

The Arts Ed Collective is the LA County initiative working to ensure every child grows up with the arts. This public-private partnership is managed by the Department of Arts and Culture, investing in school-based arts education and in community-based arts education.

When you choose the School-Based Arts Education layer, you'll see investments at the school district level. When you choose the Community-Based Arts Education layer, you'll see investments at the zip code level.

While the previous map showed only the funds LA County government invested in school-based arts education, this map shows all funds, including those raised by the Arts Ed Collective from philanthropy and other government sources. It also shows community-based arts education, which is funded entirely by philanthropy and other government sources.

School-based arts education reached 293 of LA County’s 300 zip codes, and community-based arts education reached 32 zip codes.

For more data about arts education in LA County public schools, visit the Arts Ed Profile.

DEPARTMENT OF ARTS AND CULTURE: ALL DOLLARS INVESTED

When you combine all of the Department of Arts and Culture’s annual investments together, you'll see that they reach 99.6% of zip codes in LA County, where 99.98% of the county's population lives.

As on the previous maps, each zip code is color-coded to show investment level from highest 20% of funds to the lowest 20% of funds.

You can see that the highest investments are concentrated in zip codes in the downtown area and Long Beach.

If you want to look up a specific address, city, or zip code, enter it in the “Find address or place” box and the map will zoom in. If entering an address, be sure to include the city.

Want to Share any of these maps? Click the Share button in the upper right. You can share a link or embed it in your own web page.

To learn more about the data, see our FAQs page.

DEPARTMENT OF ARTS AND CULTURE: COUNT OF INVESTMENTS

Another way to look at LA County government investments in arts and culture is to look at the count or number of investments in each zip code.

In this map, you can see the count of investments administered by the Department of Arts and Culture in each zip code, color coded by the density of programs using natural breaks in the data, from about the highest fifth to about the lowest fifth.

There are 300 zip codes in LA County. Here are the total number of zip codes reached by each of these programs:

Arts Internship Program: 75

Free Concerts: 25

Organizational Grants Program: 287

Community Impact Arts Grants: 87

School-Based Arts Education: 293

Community-Based Arts Education: 32

Tip! If you've zoomed in and want to go back to the starting point on any of these maps, just click the Home button.

DEPARTMENT OF ARTS AND CULTURE: COUNT OF INVESTMENTS COMBINED

Through all its programs combined, the Department of Arts and Culture reaches every zip code in the county. This map is color coded like the others to show the distribution of investments from the greatest to the least.

The zip code with the largest number of Arts and Culture investments is 90012, with a total of 83.

Three zip codes have only one investment

Want to know how many Arts and Culture investments are in your zip code? Enter your zip code in the “Find address or place” search bar. Or just zoom in on the map.

Note: Some school districts include more than one zip code, and their programs are counted in each zip code, so the total count is greater than 100%.

DEPARTMENT OF ARTS AND CULTURE: CIVIC ART

LA County government sets aside one percent of design and construction costs of new County buildings for the creation of civic artworks. This was expanded in 2021 to include building by private developers in unincorporated areas of the county. In addition, LA County government sometimes purchases or accessions artworks

As of 2019, there were 540 works in the LA County civic art collection. Each of those works is mapped here. They are color coded according to the department of LA County government where they are housed. Click the pin to learn the name of the artwork and the primary artist.

Zoom in on a place you like to visit in LA County to find the Civic Art works nearest you.

Learn more about Civic Art.

FUNDING FOR LA COUNTY'S LOCAL ARTS AGENCY

Nearly 4,500 local cities and counties in the United States have what's called a “local arts agency” or LAA.

In federal law, an LAA is defined as “a community organization, or an agency of local government, that primarily provides financial support, services, or other programs for a variety of artists and arts organizations, for the benefit of the community as a whole” ( 20 USC § 952(h) ).

In 2019, LA County government invested nearly $17.8M in its local arts agency, which works out to about $1.77 for every resident. By comparison, while San Diego invested $15.3M in its LAA, it works out to $11.05 per resident. San Francisco invested $29.0M in its LAA, which is $33.22 per resident.

Learn more about LAAs at Americans for the Arts.

Per Capita Arts Spending in Other Cities

OTHER DEPARTMENTS OF LA COUNTY GOVERNMENT

Other departments, commissions, and agencies within LA County government use arts and culture in a variety of ways to achieve their missions, including providing arts programming for residents. This map shows the count of investments reported by those department in each zip code.

Use the layers button to select each department individually or scroll down the list to see all other LA County departments combined. Together, these investments reach 79.3% of zip codes, where 99.7% of LA County residents live.

Click a zip code to see a list of how many different departments have programs there.

The 3 departments serving the largest number of zip codes are

  • Board of Supervisors (194)
  • LA County Library (75)
  • Office of Education (58)

As with all the maps on this site, for best results, make sure you only have one program checked at a time.

See a list of all departments, commissions, and agencies of your LA County government. Learn more about how these data were collected in our FAQs page.

COUNTY CULTURAL INSTITUTIONS IN THE COMMUNITY

The cultural institutions supported by LA County government don't just provide arts and culture at their main facilities. Many of them also provide programs across LA County.

This map shows the count of all those investments by zip code. Look up your own zip code to find out which County cultural institutions have programs there.

The zip code most served by County cultural institutions is 90036 with 470 programs.

Combined, the County cultural institutions serve 82.7% of all zip codes, where 99.85% of all LA County residents live.

ALL ARTS AND CULTURE PROGRAMS IN LA COUNTY COMBINED

This map combines the counts of all arts and culture investments provided by the County cultural institutions, Department of Arts and Culture, and other departments that can be mapped, all together.

In total, LA County government funds a total count of 8,332 arts and culture investments in 100% of all zip codes.

Click on a zip code to see the full list of all investments provided there.

While the data shows that these investments reach all of LA County, they also show that some communities receive more than others.

The ten zip codes that have the most arts and culture programs funded by LA County government are

  • 90640 (235)
  • 91773 (206)
  • 90201 (199)
  • 91214 (196)
  • 90280 (164)
  • 90001 (121)
  • 90012 (117)
  • 90606 (113)
  • 90061 (109)
  • 91011 (107)

Looking Beyond the Numbers

There are many other ways that LA County integrates arts and culture into its operations and services that aren't captured in the data above. Click on the individual blue tiles to learn more. Scroll right to see more.

Exploring Equity in LA County's Arts and Culture Investments

Down Arrow

Equity Dashboards

What you'll see next is a series of 21 Equity Dashboards showing how LA County investments in arts and culture relate to 12 different dimensions of equity:

  1. Race and Ethnicity
  2. Age
  3. Crime
  4. Citizenship Status
  5. Disability Status
  6. Transportation
  7. Internet Access
  8. Housing Cost Burden
  9. Poverty
  10. Unemployment
  11. Language Spoken
  12. Education

On each dashboard, the 10 zip codes with the largest number of LA County government arts and culture investments are highlighted. Zoom in to see how the makeup of those zip codes compares to the population of LA County on each dimension of equity.

Each dashboard is set to show all of LA County when you open it. The left column shows the percent of people who report having that characteristic in the entire county. Below that is a column chart showing all zip codes. Height of the bar chart shows the percent of people living in that zip code who report that characteristic.

There are several ways to explore each dashboard in detail.

If you zoom in and out of the map, the number in the left column will change to reflect the number of people in the visible zip codes who report that characteristic. Zip codes shown in the column chart below will change to match zip codes visible on the map.

You can click on a specific zip code in the map to learn how many people living there have that characteristic. You can learn the same thing by clicking on that zip code in the column chart.

To view all the dashboards, click the arrows to move right or left on the screen.

STRUGGLING AND PRECARIOUS LA COUNTY

If you look at communities experiencing the greatest struggles with income, education, and health in their daily lives, and compare those to the locations with the largest number of arts and culture investments, you can see room for improvement.

Measure for America has scored cities and unincorporated areas in LA County using the American Human Development (HD) Index. The areas with greatest need (Precarious LA and Struggling LA) are highlighted in yellow (Precarious) and gray (Struggling).

Use the layers list to explore how the count of LA County investments in arts and culture overlays with the areas of greatest need.

When you turn on the Arts and Culture Equity Index layer you can see how some areas of greatest need receive more investments in arts and culture than other areas of need.

Learn more about the American Human Development Index and how communities in LA County scored in A Portrait of LA County.

Child playing in the park

The future of arts and culture funding in LA County

The data presented here tell a story of significant investments in arts and culture by LA County government from large museums and performing arts venues, to community-based activities led by small and midsized arts nonprofits and individual artists, to government agencies using the arts to achieve a wide range of missions. Combined, these investments constitute one of the many vital services LA County government provides to its residents.

While the largest share of arts and culture dollars is invested in County cultural institutions – and their community programs reach zip codes where more than 99% of all residents live – one major finding to emerge was that the largest number of arts and culture investments take place in libraries.

Both are investments in institutions with fixed facilities. Investments in community-based arts and culture programming are made primarily through the Department of Arts and Culture, and they reach every zip code in the county. It is this multifaceted approach to investing in institutions, communities, and people that is a hallmark of LA County’s approach as we strive to ensure all residents have access to the benefits of the arts.

These findings also show gaps in investments and opportunities for improvement. LA County's Cultural Policy Strategic Plan offers 18 different strategies that, if funded, can improve equity, inclusion, and access to arts and culture. The data presented in this storymap show that LA County has a strong base to build on.

For more information about how the data were collected and analyzed, visit our FAQs page.

To download all the open data presented here, visit LA County's ArcGIS Online Platform.

Start Over